
This blog post is part of a “Inside the R Studio”series of stories about the basics of R programming, R Studio, and its vocabulary. To immediately receive a post when it’s out, subscribe to my Substack.
📮 Make sure you don’t miss out! Follow this blog and subscribe to an e-mail list to ensure you are among the first to get the article! Please check the rest of the website for detailed articles, cheat sheets, glossaries, and case studies.
Make sure to also download the cheat sheet based on this – click here.
Whether you are a senior data analyst or a curious individual who’s eager to enter into the world of programming, learning R language gives you an easy entryway to data analytics. This series serves as an introduction, offering insights into the fundamentals of R language, its packages, and the benefits it brings to those who use it.
We live in an era which is dominated by data. Lots of it. Extracting valuable insights is becoming more complex, and there is a myriad of tools and programming languages available in the data analytics market. From Python, R, Tableau, Power BI, SQL, and Microsoft tools – there becomes a point where not even the most experienced data analyst knows what to choose from. The issue in choosing the right tool is not in the tool itself, but often times it is a question of how to put that tool to work with other tools that are already in place and how to deal with the legacy systems of older tools.
It’s not only individuals who find it complex, it’s also the companies with versatile needs of statistical modeling and deep data analysis. Luckily, more and more companies see the full value of data-driven decision-making and use their collected data fully, to improve their product or relationship with a customer.
Five years ago, I chose R as my tool for data analytics. It was an easy choice, as it was our primary tool which we used in the last semester of college in statistics. Setting up the IDE (R Studio) and the packages seemed easy, but it does go hand in hand with knowledge of statistics. It is advised to use these education series in a way that you learn a statistical method or visualization, and then try to create it in R. When it comes to visualizations, R gives amazing options, but you can also only use R for statistical analysis and cleaning up the data, and use Tableau or any other visualization tool to present the data how you see it fit.
1. Installing R
R has its own IDE (Integrated development environment) called R Studio. Be advised that you can’t install R Studio or IDE before installing the R itself. CRAN serves as a website where you can download R and learn more about it throughout the documentation. Depending on which operational system you have, you can download R for Linux, MacOS, and Windows. There is a lot of official documentation about how to use R and do basic operations in it, as well. As for the R Studio Desktop, you can use the POSIT website. In the menu above on the website, you can see the tab Learn & Support, where you can find a bunch of cheat sheets, education, blog articles, academies for data science, and R programming. The tab “Explore More” also has versatile small education about the most general packages you will use like ggplot2, dplyr, tidyr, etc, but also more complex packages for dashboards like Shiny and flexdashboard.
2. Getting Started with R and R Studio
It is important to install R first, and then you can proceed to install R Studio on top of it. You should install both on the SSD or disc where you have a lot of free space, as the libraries are also local. Libraries are created when you install and load the necessary packages. The default settings of R are big, and for initial dabbling in the system, you won’t need any additional packages. But if you want to start with statistics, cleaning data, graphic notations, machine learning, then you should definitely start with installing packages that are suitable for that and have functions that are needed for it.
My preference is to install them right away, and then most of the time, you don’t have to worry whether you have the right package installed or not.
3. Installing packages and knowing their purpose
Depending on what you want to achieve in R, whether it is just plain coding, or do you wish to do machine learning, graphic notations, or interactive dashboards, you can install versatile packages. There are a bunch of packages that are being recommended for installing, but the ones that are the most important are:
- dplyr – data manipulation like filtering, selecting, summarizing data
- ggplot2 – data visualization
- tidyr – as the name says, it is here to tidy/clean your data, or gather and separate data.
- plotly – building quality graphs
- magrittr – chaining data
- ggraph – extension of ggplot2
- tidyverse – data manipulation
- knitr – for reporting
- readxl – reading Excel files in R
- Hmisc – describing data
- data.table – data wrangling and computation, for smaller datasets you can use dplyr.
- stringr – for text manipulation
- DataExplorer
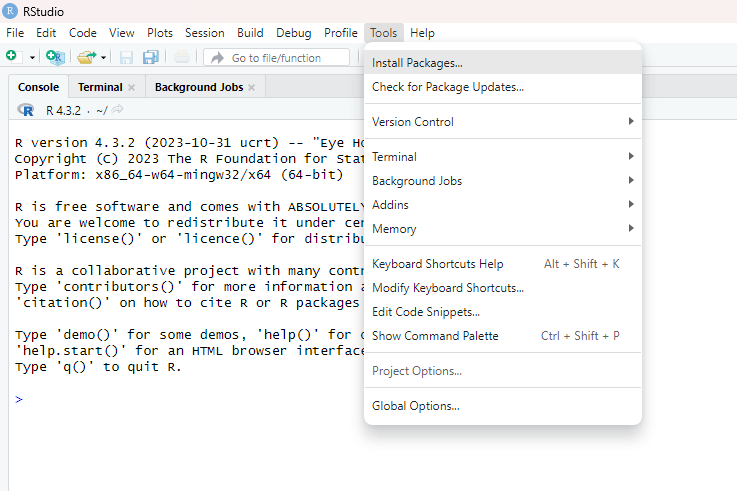
There is a whole separate list of all packages you might need throughout your data analytics journey, and I have published it separately on this website. These, and other packages you might need, you can easily install by opening your R Studio, and pressing Tools – Install packages, as shown in the picture below.
In these series of articles, we will start using R and R Studio, perform data analysis, and show you how can you use all of these packages, in order to get the information out of data(set) which you need, and to derive conclusion. And all of that being confirmed with graphics as well.
Hopefully this short guide showed you how to set up the most default version or R and R Studio. Check other series’ parts in order to check how to customize R environment and get your data in.
Follow this blog and subscribe to an e-mail list to ensure you are among the first to get the article!
