
This blog post is part of a “Statistics Essentials”series of stories about the basics of statistics and its vocabulary. To immediately receive a post when it’s out, subscribe to my Substack.
Tableau Public profile related to this article — click here.
Introduction and background of digitalization
We live in an age where the digital world and the skills connected to it can’t be avoided. Technology has made a big leap in the last 15–20 years, and the Internet has been with us for far longer than that. Whether you go to a store or a doctor, all databases are digitized, and the systems are up and running (sometimes with a few hiccups).
The goals of this article are the following:
- present the digitalization process and digital skills in Europe
- present recent research (from Eurostat) about digital skills in the EU
- use publicly open datasets about digital skills, and use Tableau to present the data — used Tableau Public

A few decades ago, when the systems were transitioning to the online/digital environment, you didn’t need to grasp new digital skills and have them in your CV, as they were new to everyone. Everyone was a pioneer in their area of expertise. Of course, at the time being, a lot of people and companies were skeptical of implementing such an environment (it happens today as well, but in a much smaller scope) because it was new, they were afraid of the unknown, and probably didn’t have enough faith in their skills to manage the downfalls if and when they occur.
Digital skills — what do they include?
Let’s first see what they include to talk about digital skills and comprehend their importance in this article. According to Europass, digital skills include the following competencies:
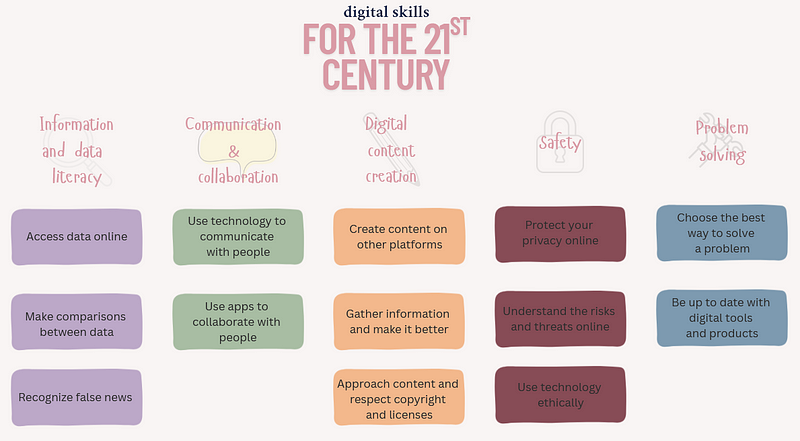
If you would like to save this picture in PDF form, please click here to download it under the name Digital skills.
As you can see, there is no particular, individually named skill that you need to tick the box for, but rather a set of skills behind using all the tools online. When you observe reality, it is visible that people have issues with data literacy (false news), online safety (protection of privacy), and digital content creation (respect of copyrights) — some places more than others, as it also highly depends on the environment and education level.
With so much AI content available and false news lately, it is sometimes impossible to know which news and source of knowledge are the safest. That said, it is also tough to keep up with all the technology advancements nowadays and with improving your knowledge and awareness in the tools. You might know which AI to use for a task, but a lot of it still is not revealed what stands behind it, and what would be the best tool to serve yourself, your customer or your team members.
In the end, a lot of companies and individuals do not want to incorporate AI tools into their business or upload documents online in such a tool because of the risks. On the other hand, a lot of people are using those kinds of tools too freely, especially in educating themselves.
Further on, let’s see how digitalization looks in versatile areas of work and how it was affected in some dire situations.
Digitalization of the marketing world
In the past, nobody believed much in the Internet. People loved their ways of working and didn’t really want to dabble into online work. People who did so were pioneers of their age and area of expertise and built the foundations of the Internet and online work as we know it today. Back then, nobody believed that news portals would replace physical newspapers, webshops to replace buying in physical stores, and ads to replace big billboards next to the highways.
You might think — “but wait, I’m drinking my morning coffee, and my newspapers were just delivered. Oh, I spilled some coffee on my shirt. Great. Ah well, I planned to go to the nearby city to renew my clothing either way. I’m bound to see a billboard ad on the way there.” You’re right — the online world and technology haven’t FULLY replaced offline. They became partners — they work and live together daily, supporting each other’s goals. Think about your purchasing process — most of the time, three situations happen:
- You go to a physical shop without checking discounts and availability online because you’re already in the area. An example might be you being in the mall and just going to visit all the shops at once. Buying at IKEA might be a good example here as well.
- You go to a physical shop, but you have done your research online and compared several stores with their prices. Most of the time, that happens when you need to buy something really important — furniture, appliances, baby furniture… If something isn’t available in the store at that moment, it might be ordered online or delivered to your address, given that there are some showcase items available in the store.
- You order everything completely online without the need to go to a store. Examples might be Amazon shopping, buying refills, or buying clothing.

Nowadays, we see digitalization in marketing and analytics in the forms of artificial intelligence (AI) and smart marketing systems such as customer data platforms (CDP) where reports and insights about your customers are being generated with one click. It only takes a person or a team with specific technical and general knowledge about marketing for such a report to make sense, such as a data or product analyst.
Such tools help out teams and individuals for their marketing goals and make the job easier, but it makes us think more about data privacy and how our data is being used. Some algorithms are known, and we know (or can assume where our data is going), but some of them are not. One of the recent changes that were made was in the old Google Analytics system vs. Google Analytics 4, which made cookie preferences and GDPR (among other processes that made an impact to it) much more different, and your data is much more securely, or more anonymously, collected and used. On the other side, it became more difficult for businesses to create meaningful and very personalized reports, campaigns without cookies and personalized data.
Digitalization and purchasing habits during and after COVID-19
For some time, during COVID-19, we went almost completely online, both socially and technologically speaking, and e-commerce thrived. Now, a few years after the pandemic, people are eager to step out in the sun and take a stroll in their favorite shops.
While e-commerce was thriving, the inventory of the shops was also thriving, which meant that after COVID measurements were loosened up and people returned to their shops, some of that inventory stayed unsold (the supply was going way up because there wasn’t any safety in saying how long the pandemic would last). After COVID-19, some of the purchasing habits stayed the same (in the sense that people are purchasing more online) because such an urgent situation and circumstances were a push that some people needed to trust the online environment and explore its opportunities. In other words, they got a push to improve their digital skills.
By doing so, using online webshops and other systems more, the digital skills of all age groups (had to) grew exponentially. Other than in purchase, change of habits was also seen in education and workplaces — schools went completely online with their courses and teachings, which made a lot of people invest more in their education, and people at work went into their home offices, using Teams and Slack to converse with their colleagues and perform jobs mostly online.

Different than the COVID perspective, now it is definitely not expected for the whole communication on a daily basis between people to be online — people need and have sought offline communication and activities, as soon as the measurements were loosened up while keeping some of their habits such as home office, to boost their work-life balance.
Digital skills and their importance
As you can see from the introduction, being digitally and technologically proficient in 2025 isn’t a choice anymore but a necessity. Every day’s improvements in marketing, sales, technology, IT, and government systems are pushing us to adapt to new changes almost daily. To stay in the job market as employees, we have a tough job to keep up with if we want our expertise for our clients and customers to be relevant enough. Using new digital systems, marketing programs, and programming languages allows us to be the best partner to our client, customer, or team member, tackle all the company and team goals, and solve problems on the market that arise.
However, not everyone has the same level of digital skills or requires them. Digital skills differ greatly between age groups and countries because of their accessibility to digital systems and economic opportunities. As said earlier, skillsets might also differ because of education, exposure, and overall attitude toward technology. Having said that, it’s stereotypical to expect that younger people have been more in touch with technology than older people (65+) and keep up more efficiently. It might be that workers in IT would be more knowing about programming languages and small details of systems.
Official numbers about digital skills in Europe
This research and article focus mainly on the European state of digitalization and digital skills, therefore, I’m using the official numbers from Eurostat.
According to Eurostat, in 2023, 97% of young people used the internet daily, but if you include all age groups, that percentage goes down to 86%. When it comes to gender, females are in a better position than males (73% vs. 69%). During and after the pandemic, we have been witnesses to fake news, false information, and disinformation on all sorts of topics. It came mostly out of doubt, low knowledge, and uncertainty. It is up to us, the news consumers, to differentiate what is fake and what is genuine news, aka we need to verify the online information and not share news that we are not sure about. In 2023, only 36% of young people and 27% of all individuals in the EU have done that! A very small portion of internet users, and it is a question of whether people know how to differentiate the genuineness of news and content they find online. As we said, because of AI, it’s very hard to be sure.
Earlier, we also said that, in the pandemic, online work and education were very popular. Now, with everything normalizing and people returning to the offices, it seems that the percentage of people has been decreasing. According to Eurostat, in 2021, 35% of young people participated in an online course, whereas in 2023, that percentage went down to 23%.
Digital skills in Europe — what do research numbers say?
As stated in the beginning of this article, I would like to make it also more educational for R programming and show how to use the ggplot2 package for data visualization. Additionally, I will be using Tableau Public to present other data. The R programming code will come later, and this article will be updated.
Details about datasets and analysis
Dataset names — you can approach datasets and download them on this link (Eurostat).
Period/time — extraction date in May 2024, planned update in May 2025 (valid for versatile years — some datasets are given each year, and some of them are only collected for one year)
Changes made — no major changes done to the original datasets; only the names were added on the graphs, instead of the codes under which you download them (given names). Not all countries are included in some graphs here because we don’t have the data for that year, or the time series has been cut off. Only countries with full available and gathered data have been included on the graphics.
Copyright of the data — CC BY 4.0 (https://ec.europa.eu/eurostat/help/copyright-notice) — valid for the original datasets and the data in this article.
Basic digital skills information
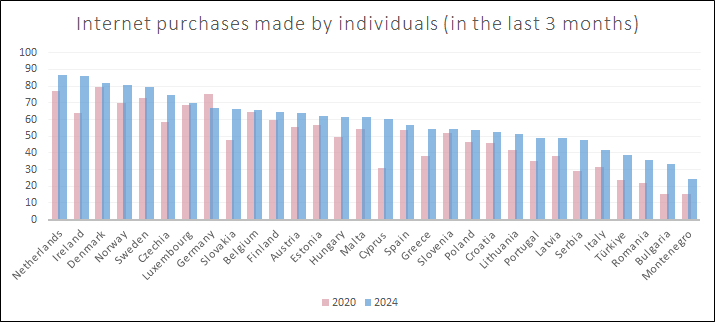
In the digital skills datasets, there are a couple of variables that can represent the digital skills of individuals in each European country, and I would like to present them here to you. Earlier in the article, I mentioned a few pillars of digital skills, and the questions you can ask yourself to check if you have the needed skills to be online. The data available in the datasets does not give exact answers to those questions, but conclusions can be made based on the research. For starters, online purchasing has been one of the main ways of purchasing back in the COVID time, so I would compare the individual internet purchases (made in the last 3 months) between the years 2020 and 2024. The next three graphs represent the presence of individuals on the internet in various forms.
Graph 1. represents internet purchases made by individuals in the last 3 months of the survey in 2020 and 2024 (with the latter year being the sorting year). When comparing countries’ data in that (2024) year, we can see that around 90% of individuals in the Netherlands have made some kind of internet purchase in the last 3 months of surveying them, followed by Ireland and Denmark. The lowest percentage belongs to the countries such as Bulgaria and Montenegro.
When it comes to 2020 (COVID time), Denmark, the Netherlands, and Germany had the highest numbers (around 80%). Usually, if a country had a higher percentage in 2020, it would keep it in 2024 as well, but there are some countries such as Cyprus where we can see a low starting number, but then later in 2024, there was an increase.
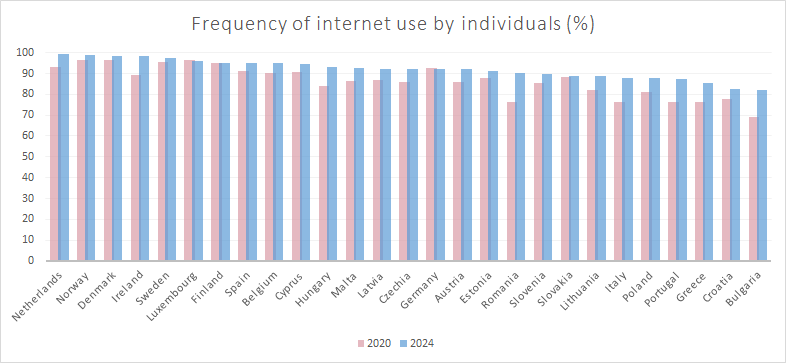
Further on, let’s explore the frequency of internet use by individuals, shown in percentage. This time on graph 2, we are also comparing 2020 and 2024. Again, the Netherlands, Norway, and Denmark are first; around 99% of their individuals used the internet in 2024. The countries with the percentage around 85% are Croatia and Bulgaria. When viewing the difference between 2020 and 2024, most of the countries don’t deviate.
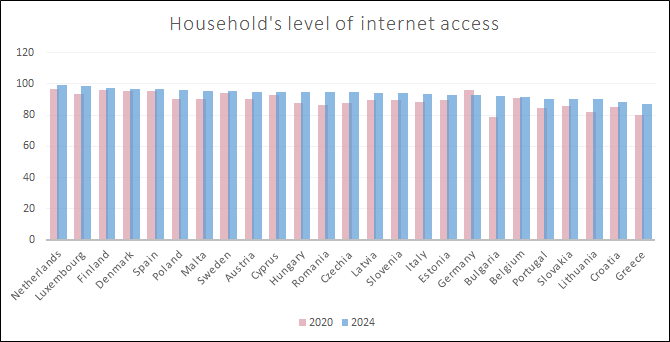
When looking at the past data in the downloaded datasets, it is visible that some countries had a lower level of internet access, at least on the household level. Graph 3. shows the level of internet access between 2020 and 2024. Again, as assumed, the Netherlands is the first, but Luxembourg and Finland are following (with 99%), whereas countries such as Croatia and Greece have around 87% coverage. I assume it’s because both Croatia and Greece have some villages and mountain areas which are not covered by electricity, roads and internet access (mainly very old population which still lives in those areas and can’t be covered by the surveys).
Details about digital skills — Tableau dashboards
These three graphs and variables were the most basic ones to show the whole EU picture about internet usage and coverage. In order to make a deeper analysis and not fully burden this article, I have decided to create an analysis in Tableau Public in the form of smaller dashboards so that you can see other, deeper parts of individuals’ digital skills.
Using Tableau, I have offered numbers, graphs, and explanations behind them for you to understand how individuals in Europe perceive privacy online, online purchases, using the internet for government and individual purposes, and much more. If you’re interested in details, please check the attached link in the beginning of the article.
Conclusion
As digitalization and digital skills continue to evolve on a daily basis, it’s clear that digital skills are no longer just “nice to have” — they’re essential for participating in modern society and work. From marketing and e-commerce to education and communication, every aspect of life has been touched by the digital ways of working.
The data presented in this article shows that while progress has been made, especially during and after the COVID-19 pandemic, differences still exist across age groups, countries, and socioeconomic backgrounds. It’s crucial for our everyday lives that we continue to promote digital literacy, not only to stay competitive in the workforce but also to deal with an increasingly complicated online world filled with information (and misinformation).
Through accessible education, responsible technology and digitalization use, and continuous learning about it, we can ensure that digital transformation benefits everyone — not just the digitally native or tech-savvy (as those might be in the minority in the world, if we would observe them as people who have the highest IT knowledge).
Additionally, with tools like Tableau (and later R Studio as well), we can also analyze and understand these trends better than ever, empowering individuals and organizations to make informed, data-driven decisions that are helpful to the whole society, clients, coworkers, and employees.
