
In this article, we will explore different types of graphs in R and provide suggestions for when to use each of them.
Tag: machine-learning
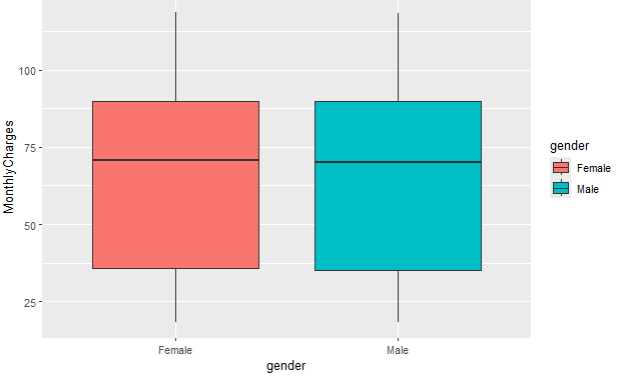
Exploring data variability: analyzing with boxplots in R
In this article, we will explore variability, and how we can approach it from box plot perspective.

Understanding Outliers in Data Analysis: Insights from R
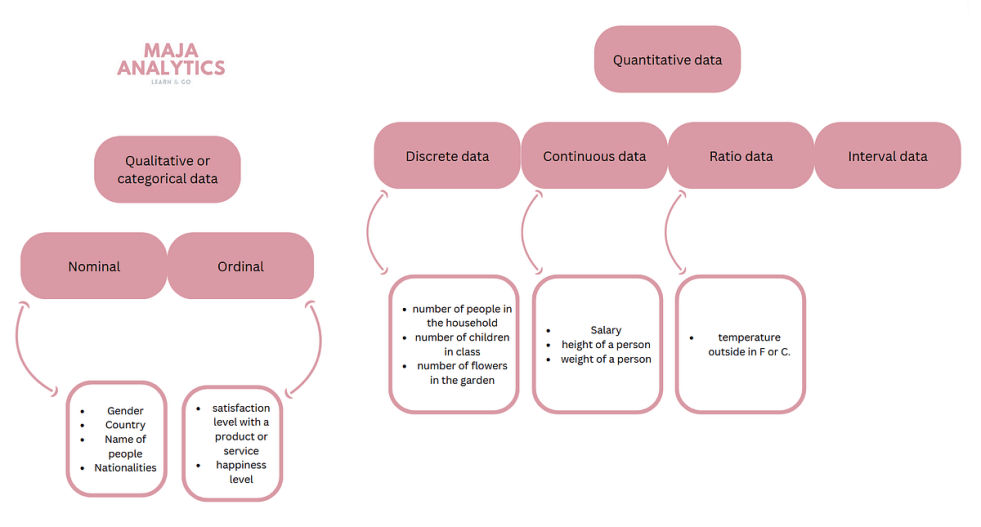
Normal distribution and normality are a rare event in data analytics. It happened almost never that you have a perfect mound, Gaussian distribution of a variable in a dataset. When that occurs, we are talking about outliers. Outliers are data points in a dataset that deviate from the rest of the data. In this article, we will discuss why does it happen and how to deal with it, in order to apply methods and techniques which have a normal distribution as a prerequisite.

Mastering the Basics: Exploring Descriptive Statistics in Data Analysis
In this article we will tackle basic descriptive statistics techniques - how do we calculate it manually and in R, and how can we apply it today?
