
To immediately receive a post when it’s out, subscribe to my Substack.
In the last few years, individualism has become increasingly visible in all areas of life worldwide. In the COVID years (2020–2021), gatherings, family life, and work situations were severely impacted by country policies, family situations, deaths, and job loss. In the meantime, several industries, such as IT, have been hit by layoffs and restructuring processes. Before the pandemic, remote work was active, but not as much as during and after.
All these factors have majorly impacted the individual and family life, especially if you look at it from the financial perspective. If a person has been laid off, or gotten severely sick over the years, non-individual life such as family life and budget will suffer, which at the end will have influence on family structure on a country level.

In this article, I will perform a data analysis/case study of the household situation in the Netherlands, to check how the family structure and other factors changed in the last few years. The articles will be divided in 2 parts:
Part 1. — Health and reproduction rates
Part 2. — Household rates and possible forecast for The Netherlands
WORLD TRENDS — WHAT DO THEY IMPACT?
Basic family structures and related structures that will be impacted by newly found situations on the (job) market and other changes are the following.
Individual households vs family households
With the newfound situation in the (job) market, new graduates are pouring in, along with employees who wish to change their industry or company. As it currently is, juniors and people without enough experience don’t have many job opportunities for them, because of the layoffs and budget cuts.
That doesn’t mean that none of them gets the job. It’s also about how competitive their (future) area of expertise is, their student work experience, projects that they have been a part of and extracurricular activities. Sometimes you get across that very well-known meme situation — a job ad where they search for a junior, with 5 years of experience working in the industry, and knowing 10 programming languages. Of course, in 99% of the cases that’s impossible to achieve.

What happens if you can’t find work? A lot of people decide to stay at their family’s place a bit longer, save on the rent and other costs. According to CBS NL, this percentage is increasing every year and is more likely for young men (although the gap is already narrowing there as well). If your life and job situation is that unpredictable, it’s not expected that individuals would find a house/apartment to buy/rent that soon, and that also affects family creation as well, from dating/finding someone and having a child. A number of individuals have said that there are multiple reasons why they are not interested in establishing a family with/without a child — unpredictable housing situation and global situation, low salary, high rent, not going out/not spending on leisure, and simply not wanting to establish a family.
In that case, you might find more individual households in a form of an individual living alone and paying rent, or renting with someone else (a roommate and such), and expecting a stagnation or a decrease in numbers of family households.
Life in rural vs. urban/city areas
Lately, it has become very popular to escape the city rush every so often, towards the seaside or in the rural areas. Working in a stressful environment, burning out, and dealing with the consequences of it forced some people to find another life for themselves — much less stressed, quieter, and with the possibility to reflect on their life so far to find solutions how to deal more efficient with stress. Decades ago, an agricultural life in a rural area wasn’t something that most young people were striving towards, wasn’t deemed glamorous, or it was too much effort for too little financial benefit.
Nowadays, we are realizing that sometimes work-life balance doesn’t work, and people respect their privacy and off-work time way more than before. Because of the preservation of free time, people are fine working less on a weekly or monthly basis, even if that might mean a lower salary, in order to preserve that peace of mind and contain stress within healthy limits.

On the other side, people might’ve inherited a smaller garden, or their family is in possession of a house with an adjacent garden/yard. Some people might’ve worked super hard for many years, and now it’s the time when they can afford to buy some little cottage of peace, in their late 30s up to late pension years because their priorities have changed. In Europe, EU funds are also a way to acquire the starter land and equipment, making it easier with lower costs. With the rising costs of food, fruit, and vegetables, a lot of people are now enjoying working in their own gardens, producing their own food, finding happiness in it, and also cutting their everyday costs.
If you would “confine” yourself in the rural area, that doesn’t necessarily mean that you would not have any job opportunities. As I said earlier, yes, rural areas and the agriculture industry might not have been as glamorous in the past, were much more significantly laborious. Today, with technology, many industries can connect with agriculture, automatizing many of the processes, and making the move to rural areas more appealing. Still, even with all the advantages now, cities still remain the main hubs for education and further career advancements.
Marriage vs. partnership vs. cohabitation families
Choosing between these three options, especially in some countries, might be a question of tradition, culture, and finance. Back in the days, it was normal to get married, get a job, and have a family, in that order. Recently, new forms have replaced the original, traditional form of marriage, and it came in the forms of partnership and cohabitation (living together, but not being married), but also living alone.
This structure is tightly connected with the first point of individual households vs. family households, but it gives the latter another additional dimension. By law, it differentiates what a family means and stands for, as well from the fiscal standpoint.
Housing situation
The housing situation represents a highly specific situation in the Netherlands. The country is in need of workers with versatile educational backgrounds, but the migration process is somewhat controlled/stopped/blocked by the housing situation. There is simply not enough housing for everyone, especially not rooms, and houses for a lower amount of money. Because of the demand/supply process and inflation, the prices of the houses/rooms keep going more and more up, sometimes even exponentially, which leaves migrants who wish to relocate to NL, and the citizens of NL without their own homes. It is a very well-known situation to most of the migrants, Dutch people, and also students who would like to study in one of the major cities.

The “entrance cost” or the average price of a home is quite high. It’s going somewhere between 300.000 and 400.000 euros, and even more for the houses around Amsterdam and other cities where the IT industry and education hubs are located in (up to 700.000 euros). It is quite simply visible that the majority of young people can’t afford their own house, forcing them to rent with someone else or continue living with their parents for a longer period of time.
Connecting that with the job market, sometimes the salaries are just not high enough for the person to purchase their own home in their 20s and 30s, at least not without a debt/loan. If you’re dealing with layoffs, then it’s quite understandable that you would put those big life plans on hold, and that has an impact to the family structures that we will be observing.
Migration numbers
Migration is and always will be a natural process of moving. As borders start to disappear, and countries open themselves even more, the migration numbers keep rising. Some countries have issues with not having enough workers for specific industries, some industries aren’t attractive enough, salaries are lower than somewhere else, or there is a discrepancy between education and the real job market. All of those mentioned issues are not so easy to fix in the short team, especially the latter one.
In order to fill those jobs, migration might be one of the processes used in the short term. It happens often that workers from poorer countries move to richer countries in order to earn for their families, or whole families move to a new country. Of course, migration also happens because of other reasons — someone might like the new country, costs are lower, quality of life is better, better educational systems and career opportunities.
How did the family structures change over time?
With the shifts in social norms, economic factors, and cultural diversity caused by technological advancements and migration, family and household structures have changed over time. To present how and why they may have changed, I have used the CBS StatLine’s dataset on several variables that were explained above.
Dataset information
Source of the data — CBS StatLine’s dataset (open data portal)
Period — 2006 to 2023 (the year 2006 was chosen as the beginning of the period because it might show us what happened during the economic crisis in 2008)
What changes are made to the dataset — no major changes, the names of the variables were adjusted for a graphical representation
Tools used — Tableau Public, Microsoft Excel
Health status of the country — birth and reproduction rates
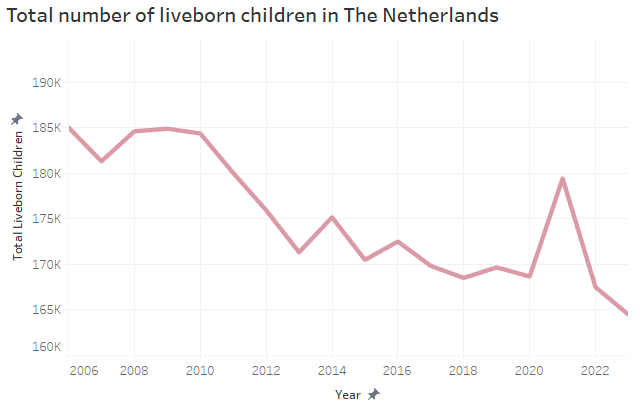
Let’s start off by showing the health status of the country, by presenting birth and reproduction rates in the span of 18 years. As in most countries, NL is not any different in terms of the number of liveborn children and rates. The total number of liveborn children in NL had its peak in the period of 2008–2010, with it decreasing until 2020. In the early post-COVID years (2021), it seems that the total number has risen for about +10.000 children (vs. how it was in 2019), but it still declined after that period.
When it comes to the net reproduction rate in the Netherlands, it is calculated as the average number of daughters a group of women would give birth to, if certain age-specific fertility and mortality figures were to apply.
It follows the same trend as the graph above, with a decrease of over 10% from 2010 to 2020. In the post-COVID years (2021), there was an increase of 5% (vs. 2020), but there was a very sharp decrease after that, with less than 70% of the reproduction rate in 2023.

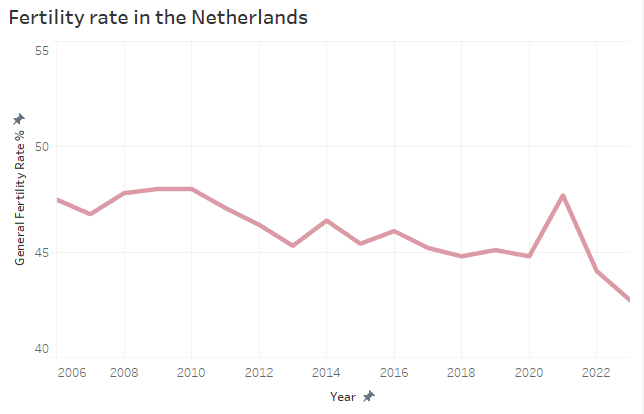
The fertility rate is calculated as the number of live-born babies per thousand of the average number of women aged 15 to 50 in the period of observation.
This rate has been more stable over time, with again having its peak in 2021. All of these three are connected, as the rates are being calculated from the total number of live-born children, so the movements/trends are also following almost the same path.
Age of the parents
Back in the day, it was normal that you would get your first child before you were 20 years old. Nowadays it is much more common to spend your 20s building a career, studying at the university, and having a leisurely life.
In the last 20 years, that age line has increased more and more. As you can see on the graph, men’s average age at the birth of their first child is between 32 and 34 years (pink line), whereas it’s slightly lower for women — a bit above 30 (orange line).

To have a deeper look into the women’s age (as mothers) at their child’s birth, we can also observe that women who get a child are mostly between 25 and 35 years of age. The least women are younger than 20 years and older than 40 years.

Marriage rates among mothers
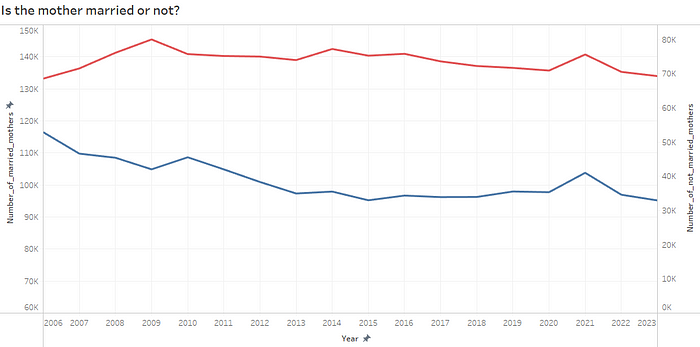
If we observe women as mothers even further, we can ask ourselves if they are married at the moment they get a child or not, for us to start off the research of marriage changes in the country.
The red line represents the amount of women who were not married in the moment they have gotten a child, and the blue line represents the women who were married at that time. As you can see, in the observed period, there was much more women who were not married than the ones that were. There isn’t much trend visible here, except for a small decrease of women who were married, but it’s not as remarkable to see it.
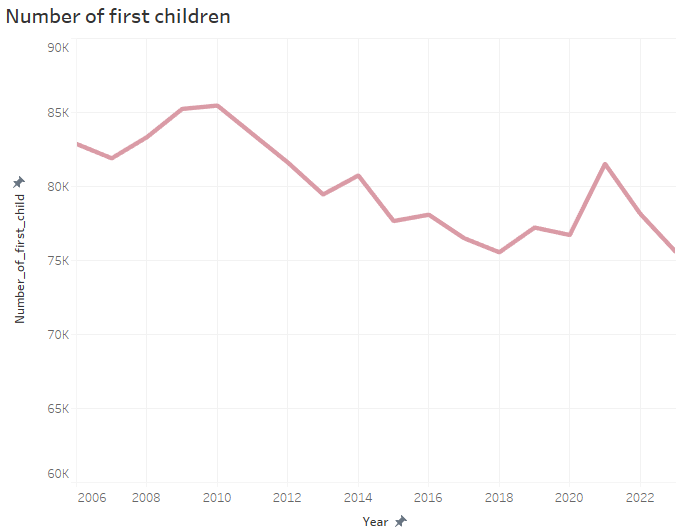
Among all born children, there is a variable which counts the number of first children in that group of all born children. As you can see, in the observed period, there is a decrease of about -10.000 from 2010 to 2018, with a new peak in 2021, followed by a decrease on pre-COVID levels.
If we compare the number of first born children with the number of total born children, we would see that first children make around 45–50% of all born children on a yearly basis, which is a good thing for fertility and reproduction rates.
Conclusion of Part 1.
In this article we have viewed the global and local issues such as layoffs and situation on a global scale and their influence on family structure. As an example, the Dutch family structure was taken, and we have presented its fertility and reproduction state in the period from 2006 to 2023.
As most of the European countries, the Dutch family structure is showing the decrease in the fertility and reproduction rates, viewed by the total number of born children on a yearly basis. Nevertheless, the discrepancy between numbers of living and dead on a yearly basis is not as grave as it might be in some other countries, where the age pyramids are much more distorted from the “ideal” one.
In the next, Part 2. article, we will discuss how does the average household in the Netherlands look like, and we will check if we can observe the situation and fact that more and more young people are staying at home, because of non-affordability of their own home, given the financial and global situation.
