
This blog post is part of a “Statistics Essentials”series of stories about the basics of statistics, and its vocabulary. To immediately receive a post when it's out, subscribe to my Substack. In data analytics and statistics, it is essential to understand the distribution of the dataset, how the data was collected, and its goals. More… Continue reading Cheese, Butter, and Data: A Complete R Data Analysis Guide using Dutch Dairy Production Data
Category: Statistics Essentials

Enhance Data Insights with the 5 W’s Framework and People’s Perspective
We are living in an era of big data and versatile challenges in business. Read how to tackle that and always have the right answers to your questions via The 5 W's Framework.

The importance of skewness and kurtosis in statistical analysis — examples in R Studio
When performing a statistical analysis, understanding the shape of data is important for good interpretation and further decision making. If you fail to identify potential outliers in a dataset, all models that might come out of it might be wrong and non usable, leading to wrong results. In this article, I’m tackling the topic of skewness and kurtosis and why is it important in statistical analysis.
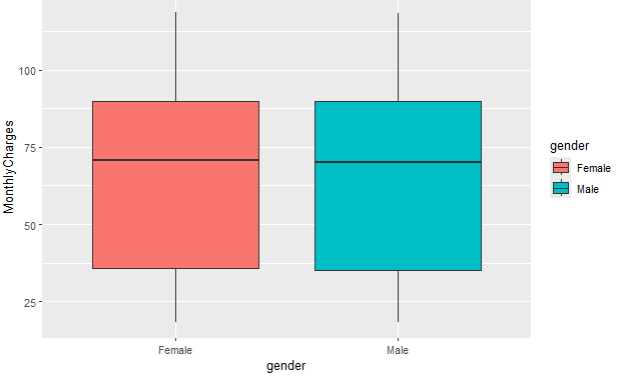
Exploring data variability: analyzing with boxplots in R
In this article, we will explore variability, and how we can approach it from box plot perspective.

Understanding Outliers in Data Analysis: Insights from R
Normal distribution and normality are a rare event in data analytics. It happened almost never that you have a perfect mound, Gaussian distribution of a variable in a dataset. When that occurs, we are talking about outliers. Outliers are data points in a dataset that deviate from the rest of the data. In this article, we will discuss why does it happen and how to deal with it, in order to apply methods and techniques which have a normal distribution as a prerequisite.
