
In this article, I will perform a data analysis/case study of the household situation in the Netherlands, to check how the family structure and other factors changed in the last few years.
Tag: Analytics
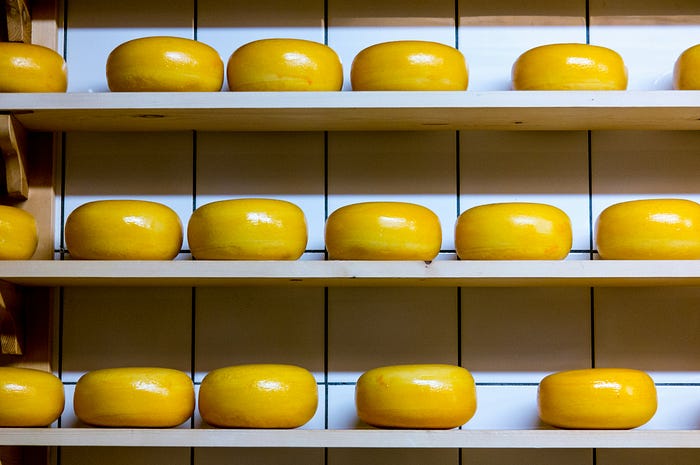
Cheese, Butter, and Data: A Complete R Data Analysis Guide using Dutch Dairy Production Data
This blog post is part of a “Statistics Essentials”series of stories about the basics of statistics, and its vocabulary. To immediately receive a post when it's out, subscribe to my Substack. In data analytics and statistics, it is essential to understand the distribution of the dataset, how the data was collected, and its goals. More… Continue reading Cheese, Butter, and Data: A Complete R Data Analysis Guide using Dutch Dairy Production Data

Enhance Data Insights with the 5 W’s Framework and People’s Perspective
We are living in an era of big data and versatile challenges in business. Read how to tackle that and always have the right answers to your questions via The 5 W's Framework.
A Guide to Hypothesis Testing Tests and Their Underlying Assumptions
In this series, I’m covering the topic of hypothesis testing, and how to proceed with it in an R environment. Last time I talked about what hypothesis testing is, and what are the crucial parts of it. In this article, I will discuss more appropriate tests you can select, their assumptions, and what to do when those assumptions are unmet.

The importance of skewness and kurtosis in statistical analysis — examples in R Studio
When performing a statistical analysis, understanding the shape of data is important for good interpretation and further decision making. If you fail to identify potential outliers in a dataset, all models that might come out of it might be wrong and non usable, leading to wrong results. In this article, I’m tackling the topic of skewness and kurtosis and why is it important in statistical analysis.
